
FAERS Reporting Odds Ratio Calculator
How to Use This Tool
This calculator helps you compare side effect reporting rates between two drugs using the FAERS database. Important: This is not medical advice. FAERS data shows signals, not proof of causation.
Remember: FAERS reports are unverified. More reports don't equal higher risk. The number of people taking the drugs (denominator) matters. This tool uses Reporting Odds Ratio (ROR) for comparison.
Reporting Odds Ratio Results
Interpretation: This tool calculates the relative risk of the specified side effect between the two drugs. A value greater than 1 suggests higher reporting for Drug A compared to Drug B. Remember: This is only a signal — not proof of causation.
How ROR Works: The Reporting Odds Ratio compares the odds of reporting a side effect with Drug A versus Drug B. It's calculated as (cases_A / total_A) / (cases_B / total_B), where total is the number of people taking each drug.
When you’re trying to understand if a medication might cause unexpected side effects, the FAERS database is one of the most powerful tools available. But it’s not a simple lookup. It’s a massive, real-time collection of reports from doctors, patients, and drug companies - and if you don’t know how to use it right, you’ll walk away with more confusion than clarity.
What FAERS Actually Shows (And What It Doesn’t)
The FDA Adverse Event Reporting System (FAERS) collects reports of side effects, medication errors, and product quality issues for drugs and biologics. Since August 2024, it’s been updated in real time - no more waiting three months for new data. That’s a big win. But here’s the catch: every report in FAERS is unverified. Someone filed it. That’s it. No FDA scientist confirmed the link between the drug and the reaction. No lab tests, no medical records reviewed.
That means if you see 500 reports of dizziness linked to Drug X, it doesn’t mean 500 people had dizziness because of Drug X. Maybe 400 of those people were also on other meds. Maybe 100 had pre-existing balance issues. Maybe 200 reports came from one pharmacy chain that automatically files every complaint. FAERS doesn’t tell you the denominator - how many people actually took the drug. Without that, you can’t calculate risk.
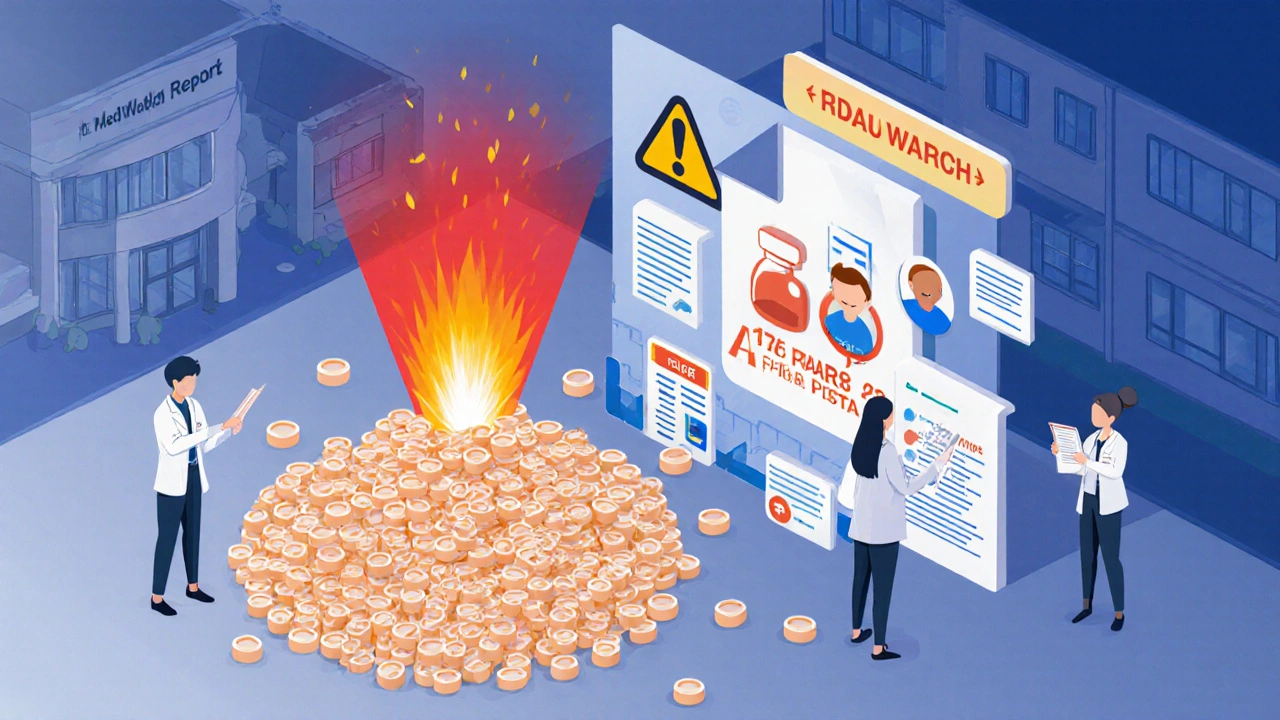
Think of FAERS like a smoke alarm. It doesn’t tell you where the fire is, or how big it is. It just tells you smoke was detected. Your job is to investigate further.
How to Search FAERS Like a Pro
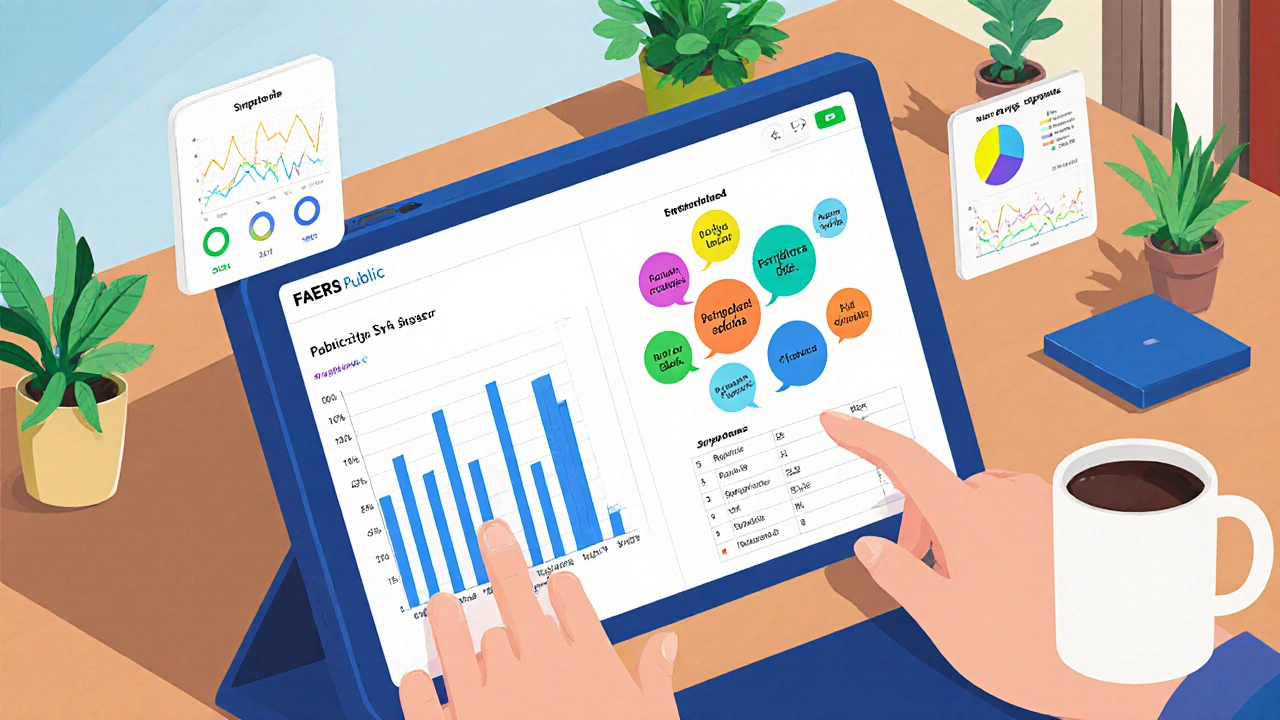
The easiest way to start is with the FAERS Public Dashboard. Go to the FDA’s website, find the dashboard, and click the blue search bar. Type in the generic name of the drug - not the brand. For example, search “metformin,” not “Glucophage.”
Here’s where most people mess up: they stop at the first screen. After you search, you’ll see a bar graph showing reports by year. That’s just the surface. To see actual side effects, look to the right of the graph. There’s a dropdown menu labeled “Cases by Reaction.” Click it. Now you’ll get a list of symptoms reported - like nausea, fatigue, liver injury, or even rare events like pancreatitis.
But here’s the trick: drugs have many names. If you’re looking at a drug like lisinopril, also try searching “Zestril” or “Prinivil.” The dashboard only lets you search five drug names at once, so plan ahead. If you’re comparing two drugs, search them separately and note the patterns.
Filtering helps. You can narrow results by patient age, gender, report outcome (like hospitalization or death), and even reporter type (doctor vs. consumer). This matters. Reports from doctors tend to be more detailed. Consumer reports are often vague - “I felt weird after taking it.” Use both, but treat consumer reports as red flags, not proof.
Advanced Tools for Deeper Analysis
If you’re a researcher, pharmacist, or someone digging into a specific safety concern, the Public Dashboard isn’t enough. That’s where tools like VisDrugs come in. It’s a free web tool built specifically to make FAERS data easier to interpret. Instead of scrolling through lists, VisDrugs shows you pie charts of the most common side effects and forest plots that compare how often a reaction occurs with Drug A versus Drug B.
For example, if you want to know whether Drug X causes more joint pain than Drug Y, you can input both into VisDrugs. It calculates reporting odds ratios - a statistical way to measure if one drug is linked to a side effect more than another. It even breaks it down by age group. You might find that joint pain is rare in people under 50 with Drug X, but common in those over 70. That’s the kind of insight you won’t get from the basic dashboard.
Another option is PharmaPendium, a commercial platform used by pharmaceutical companies and researchers. It lets you use Boolean logic (AND/OR/NOT) to build complex searches. You can compare entire drug classes - say, all SGLT2 inhibitors - or filter by reporter occupation. If you’re looking at reports from nursing homes versus hospitals, that can reveal patterns tied to care settings.
What You Should Never Do
Don’t use FAERS to decide whether to stop a medication. If you’re worried about a side effect, talk to your doctor. FAERS data is for spotting signals, not making personal medical decisions.
Don’t assume a rare side effect listed in FAERS is common. If you see one report of a stroke linked to a drug, that doesn’t mean it’s a frequent risk. In fact, most reports are for common side effects like headache or upset stomach. Rare events are harder to spot because they’re buried in noise.
Don’t confuse FAERS with MAUDE. If you’re looking for side effects from a medical device - a pacemaker, a joint implant, a glucose monitor - go to the MAUDE database. FAERS is only for drugs and biologics. Searching FAERS for a device will give you nothing useful.
And don’t rely on the raw data files unless you’re a data scientist. The FDA releases quarterly downloads of all FAERS reports - 2.7 million entries as of Q3 2024. But they’re messy. They’re in CSV format with codes like “M50.9” (back pain) and “R50.9” (fever). You need to map those to MedDRA terminology. Most people can’t do this without training.
How the FDA Uses FAERS
The FDA doesn’t just sit back and wait for reports. Their Office of Surveillance and Epidemiology has about 50 staff members who monitor FAERS daily. They look for spikes - sudden increases in reports of a specific side effect. For example, if 10 reports of liver failure come in for a new diabetes drug in one month, and the previous average was one per year, that’s a red flag.
When they see a pattern, they investigate. That might mean reviewing medical records, contacting the reporting doctors, or running their own studies. If the signal holds up, they can take action: add a black box warning to the label, restrict who can use the drug, or even pull it off the market. In 2023, the FDA downgraded the bioequivalence status of a generic statin after FAERS data showed higher reports of muscle damage compared to the brand.
That’s the real power of FAERS. It’s not about proving harm. It’s about finding clues that lead to proof.
Real-World Example: A Patient’s Story
A 68-year-old woman in Ohio started taking a new blood pressure med. After three weeks, she had severe swelling in her ankles and trouble breathing. Her doctor dismissed it as “just fluid retention.” She filed a report with FAERS through her pharmacy.
Two months later, 12 other reports came in with the same symptoms. VisDrugs picked up the pattern - a 400% spike in peripheral edema for that drug compared to similar ones. The FDA reviewed the data, checked clinical trial records, and found a previously unknown interaction with a common potassium supplement. Within six weeks, the label was updated to warn against combining the two.
That woman didn’t change the system. But her report helped someone else avoid the same problem.
Final Tips for Using FAERS Wisely
- Always search by generic drug name first.
- Use the “Cases by Reaction” dropdown - never stop at the yearly graph.
- Filter by age and outcome to spot high-risk groups.
- Use VisDrugs for comparisons between drugs.
- Remember: more reports ≠ higher risk. Context matters.
- Never use FAERS to make personal treatment decisions.
- For devices, use MAUDE - not FAERS.
FAERS is a window into real-world drug safety - not a crystal ball. It’s messy, incomplete, and sometimes overwhelming. But when you know how to read it, it’s one of the most transparent tools the public has to understand what drugs are really doing in the real world - not just in clinical trials.
Is the FAERS database free to use?
Yes, the FAERS Public Dashboard is completely free and open to the public. You don’t need an account, subscription, or special access. The FDA also provides downloadable raw data files for free, though these require technical skills to analyze.
Can I trust FAERS reports as proof a drug caused my side effect?
No. FAERS reports are unverified and unconfirmed. They’re signals, not evidence. A report says someone took a drug and then had a reaction - but it doesn’t prove the drug caused it. Other factors like underlying conditions, other medications, or coincidences could be responsible. Only clinical studies or FDA investigations can establish causation.
Why do some drugs have so many more reports than others?
It’s not always about safety. Drugs that are used by millions - like metformin or lisinopril - naturally have more reports simply because more people take them. Also, older drugs have been on the market longer, so more reports have accumulated. A new drug with only 50 reports might be riskier than an old one with 5,000 - you can’t tell just by counting.
How often is FAERS updated now?
Since August 22, 2024, FAERS has been updated in real time. This replaced the old quarterly update schedule, which meant safety signals could take up to three months to appear publicly. Real-time updates help the FDA respond faster to emerging safety concerns.
What’s the difference between FAERS and MAUDE?
FAERS is for drugs and biologics - things you swallow or inject. MAUDE is for medical devices - things like pacemakers, joint replacements, or insulin pumps. They’re two separate systems with different reporting rules and data formats. Searching FAERS for a device won’t work.
Can I report a side effect to FAERS myself?
Yes. Consumers can report side effects directly to the FDA through the MedWatch portal. You don’t need a doctor’s note. The report will be added to FAERS. Even if you’re unsure if the drug caused the problem, it’s worth reporting. These reports help the FDA spot patterns.
Mqondisi Gumede
November 27, 2025 AT 05:15Albert Guasch
November 27, 2025 AT 10:23Douglas Fisher
November 27, 2025 AT 11:49Stephanie Deschenes
November 29, 2025 AT 09:04Cynthia Boen
November 30, 2025 AT 23:26Amanda Meyer
December 1, 2025 AT 21:39Jesús Vásquez pino
December 3, 2025 AT 13:18hannah mitchell
December 3, 2025 AT 17:19vikas kumar
December 5, 2025 AT 10:03Vanessa Carpenter
December 6, 2025 AT 16:14Bea Rose
December 6, 2025 AT 18:36